Reading crypto markets in Singapore time
How a 24-hour digital-asset market looks from SGT — US-session overlap, weekend gaps, liquidity pockets — and why a chart is a record, not a forecast.
Editorial Desk · 9 December 2025 · Updated 9 December 2025
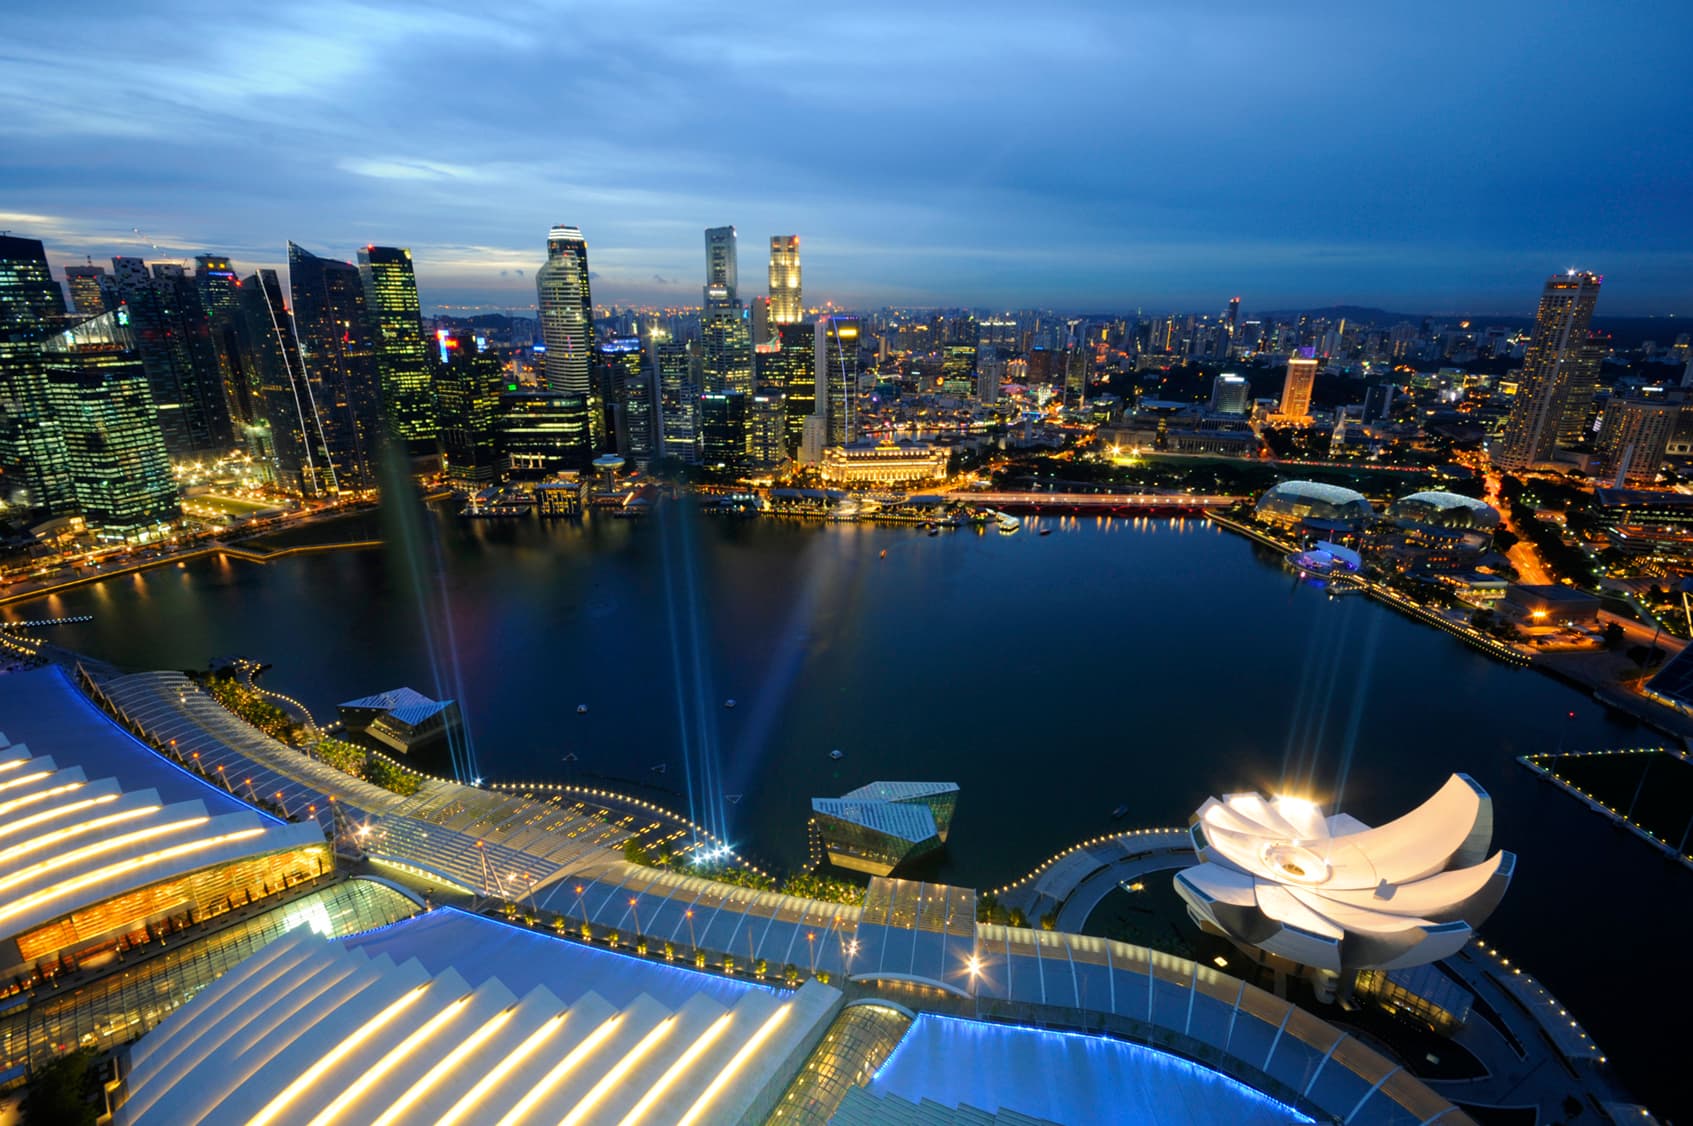
Image: Marina Bay and the Singapore skyline at dusk — William Cho / CC BY-SA 2.0. See the image credits page.

A reader in Singapore who opens a bitcoin chart at 7am on a weekday is not looking at a market that has just “opened”. They are looking at a market that has already been through New York’s afternoon, London’s close, and whatever happened in the Gulf after midnight. Digital-asset books do not keep Singapore Exchange hours. They do not keep Tokyo hours either. They keep a messy, around-the-clock auction whose personality changes with the clock on the wall in Raffles Place.
This piece is about that clock. It is not a trading plan. It does not say when to click. It explains why the same percentage move feels different at 10am on a Tuesday and at 2am on a Sunday, and why a beautifully coloured chart is still only a record of prints.
For a primer on the asset most of those charts display, see bitcoin for Singapore readers. For the plumbing behind a quoted spread, see liquidity, spreads and weekend gaps. Both sit in the markets hub with this briefing.
There is no opening bell — only overlapping crowds
Traditional markets teach a habit that is hard to unlearn. Equities in Singapore have a pre-open, an open, a lunch-adjacent rhythm, and a close. US cash equities have a 9.30am Eastern open that still organises global attention. Foreign-exchange desks talk about Tokyo, London and New York as if they were rooms a person could walk through.
Crypto inherited the foreign-exchange idea and then discarded the rooms. Bitcoin and the more liquid tokens trade on many venues, in many time zones, without a central close. What you can still observe — if you look at volume, depth and volatility rather than at a single line — is that people still have rooms. Desk staff in London go home. US equity traders arrive. Singapore compliance teams are asleep. The network does not care. The order books do.
A practical map, in Singapore time, looks roughly like this.
- Morning SGT (about 8am to noon). Asia is at the desk. Japan, Korea, Hong Kong and Singapore overlap. For many tokens this is not the loudest window. It can be a perfectly adequate window for anyone who only wants to understand a cash price on a licensed book. It is a poor window in which to assume that “nothing happened overnight”. Plenty did. You are reading the aftermath.
- Afternoon SGT (about noon to 6pm). Europe wakes and then works. London’s morning is Singapore’s late afternoon. Spreads on the more liquid pairs often look more civilised than they did at 7am. This is still not a forecast of direction. It is a comment on who is present.
- Evening into night SGT (about 9.30pm onward). The US cash session opens. Depending on American daylight saving, that bell is 9.30pm or 10.30pm in Singapore. From here until the small hours, crypto often behaves as if it were a high-beta cousin of US risk assets — not because a statute says so, but because the same discretionary accounts are awake. Liquidations on offshore derivatives venues cluster here more than they cluster at 11am SGT.
- The dead hours before the CBD starts walking. Someone, somewhere, is always trading. Depth is not always there with them.
These are tendencies. They fail on public holidays, on Federal Reserve days, on nights when a stablecoin wobbles, and on ordinary Tuesdays when nothing in particular happens. A map is not a timetable.
What “US session overlap” actually means from SGT
Three things people bundle under one label
The phrase is used lazily. Three different things get bundled.
First, US cash equities are open. News about rates, jobs and listed companies arrives in a window that is evening and night in Singapore. Crypto prices, especially bitcoin, often twitch when those headlines hit. Correlation is not causation, and it is not stable. There are months when bitcoin trades like a risk asset and months when it trades like an orphan.
Second, US-regulated and US-facing crypto venues are in their working day. Even a reader who never opens those venues feels their prints, because prices are arbitraged across books when the pipes work.
Third, leveraged offshore products — perpetual futures in particular — are most dangerous when US hours and thin collateral collide. A funding-rate curiosity at 4pm SGT can become a cascade at 1am. The person who wakes up to a red number did not necessarily “miss the Asia session”. They missed someone else’s afternoon.
A reader who only uses a MAS-licensed platform still lives with this clock. The licensed book is not sealed off from the global price. It is usually trying to stay close to it. When the global price gaps, the local book gaps, or the spread blows out, or withdrawals pause, or all three.
A chart is a record of transactions that already happened, on the venues that the charting service chose to include, at the timestamps those venues reported. It is not a model of fair value and it is not a promise of the next print.
Weekend gaps are about people, not about block times
Bitcoin does not close on Saturday. The chain produces blocks whether or not anyone in Tanjong Pagar is awake. So why do people talk about weekend gaps?
Because liquidity is a social fact. Market-makers go home. Hedging desks reduce inventory. Some platforms restrict features. Retail attention drifts to other things. The remaining book can look fine in the middle — a tight bid and offer on a screenshot — and still be two centimetres deep. A modest market order then walks the ladder. The print looks like a crash or a melt-up. On Monday, when people return, the book fills in and the weekend wick becomes folklore.
Gaps also appear at the join between Friday night in New York and Saturday morning in Singapore, and again on Sunday evening as Asia prepares for Monday. None of this is mystical. It is what happens when a 24-hour system is staffed by humans who prefer to sleep.
Two cautions follow.
Do not treat a weekend print on an offshore perpetual as the cash price you would have received on a licensed Singapore book. The products are different, the counterparties are different, and the depth is different.
Do not treat the absence of a move as safety. A quiet Saturday can be a coiled Saturday. Quiet is not the same as deep.
Liquidity is not a vibe, and SGT changes what you can see
“The market is liquid” is a sentence that should be followed by for what size, on which pair, on which venue, at which hour. A hundred Singapore dollars in bitcoin on a major pair at 4pm on a Wednesday is a different problem from a large advertised “block” in an alt-token at 11pm on a Friday.
From Singapore, three distortions show up often.
The first is screenshot liquidity. An app shows a last price in large type. It does not show the next five levels of the book, the last time a sizeable order actually cleared, or the fact that the last price was a derivative mark. Readers who want the vocabulary of bid-ask, depth and slippage will find it in the liquidity briefing linked above. The SGT-specific point is simpler: a last price at 3am can be a lonely price.
The second is imported volatility. A move that began on a US venue arrives on a Singapore book as a fait accompli. Local morning commentary then treats it as an Asian story. Sometimes it is. More often it is a New York story wearing a Singapore timestamp.
The third is calendar blindness. Deepavali, Chinese New Year, Christmas and the US Thanksgiving week all change who is present. A “typical Tuesday” model fails on those weeks. So does any model that assumes the Straits Times Index and bitcoin share a diary.
Why a chart is not a forecast — even a very expensive-looking one
Charting tools are good at two jobs. They compress history. They make patterns easy to name. They are bad at the job marketing copy assigns them, which is telling you what happens next.
A few reasons, stated without mysticism:
History is not a controlled experiment. The fact that a shape appeared before a rise in 2021 does not bind 2026. The participants are different. The leverage is different. The regulation in Singapore is different.
The axis can lie by omission. A log chart and a linear chart of the same data tell different emotional stories. A chart that begins at the last low is an argument, not a photograph. Some popular charts blend venues, use derivative indexes, or omit hours when a book was broken. Indicators lag: they are transformations of past prices, useful as descriptions and harmful when treated as statutory signals.
None of this is an argument against looking at charts. It is an argument against asking a record to do the work of a thesis. Write the reason in sentences. The candles can illustrate the sentences. They cannot replace them.
A Singapore working method, not a strategy
People who have to explain a digital-asset price to someone else — a finance director, a compliance officer, a sceptical parent in Bishan — need a method that survives contact with the clock.
Start with the timestamp. Translate it into SGT and into the other session that was awake. If the move happened at 2am on a Sunday, say so. Do not file it under “Asia sold”.
Name the venue. A licensed platform’s cash pair, an offshore perpetual index and a coin-tracking website are three publishers. They can disagree by more than a casual reader expects.
Look at depth, not just last. If you cannot see the book, you are looking at a headline, not a market.
Separate the network from the book. A blockchain continuing to produce blocks is not evidence that a particular exchange can honour withdrawals. The inverse is also true.
Refuse the forecast question if you do not have a forecast. “The US session is still open and the book is thinner than yesterday” is a complete answer. “It will bounce because it is oversold” is a different genre, and not one this desk publishes.
The clock on the wall in Singapore is not an obstacle to reading these markets. It is the first fact. Once you know who is awake, you can decide what a candle is allowed to mean — which is usually less than the colours imply.
Questions readers send the desk
- When is the “US session” for a reader in Singapore?
- There is no official session bell for bitcoin. In practice, activity often thickens when US cash equities are open. That is late evening into the small hours, SGT — roughly 9.30pm to 5am when America is on daylight time, and an hour later in winter. Treat it as a habit of the crowd, not a timetable from an exchange.
- Do crypto markets close at the weekend?
- The major public networks do not close. Many order books stay up. What changes is participation. Depth can thin, spreads can widen, and a move that would be absorbed on a Tuesday can print as a gap on a Sunday night in Singapore.
- Can I use a screenshot of a candle as evidence of “the price”?
- A screenshot is evidence of what one venue displayed at one moment, for one pair, on one timeframe. It is not a valuation, not a forecast, and often not even the price a retail order would have received. Compare venues and look at depth before treating a picture as a fact.